Every webinar, virtual event and live stream you run leaves behind a trail of evidence. Who registered. Who actually showed up. What they clicked, watched, asked and skipped. The problem is not a shortage of data. It is that most of it is collected, stored and then quietly ignored.
If your post-event routine ends with a headline attendance figure and a sigh of relief, you are leaving your most valuable asset on the table. Event data analytics is the discipline of turning that raw exhaust into decisions you can act on: better content, sharper targeting, and a number your finance team will actually respect.
What is event data analytics, really?
Event data analytics is the practice of collecting, connecting and interpreting the signals your events generate, then using them to improve future events and prove commercial value.
It splits neatly into three layers:
- Descriptive: what happened. Registrations, attendance rate, average watch time, poll responses, drop-off points.
- Diagnostic: why it happened. Which promotion channel drove the most engaged attendees, which session lost the room.
- Predictive: what to do next. Which registrants are likely to convert, which topics deserve a follow-up event.
Most teams live entirely in the first layer. The value sits in the second and third.
Which event metrics actually matter?
Vanity metrics feel good and change nothing. A registration count of 2,000 means little if 300 turned up and none engaged. Focus on the numbers that connect to a decision.
Attendance rate. Registrations against live attendees. A low rate points to reminder sequences, timing or topic relevance, not audience quality.
Engagement depth. Average watch time, poll and Q&A participation, chat activity and resource downloads. This tells you whether your content held the room or merely filled it.
Drop-off points. The exact minute people leave reveals more than any survey. A cliff at minute 12 is a content problem you can fix.
On-demand behaviour. For webinars especially, the live audience is only half the story. Many of your most valuable viewers watch later. Track them.
Pipeline influence. Which attendees moved forward, requested a demo or entered a deal cycle. This is the metric that ends the annual argument about event budgets.
How do you connect event data to revenue?
The single biggest failure in event analytics is the walled garden. Your webinar platform knows engagement. Your CRM knows revenue. If the two never speak, you can never draw a straight line from a live poll answer to a closed deal.
The fix is integration. When your event platform passes attendee and engagement data into your marketing automation and CRM, every interaction becomes a scored, attributable signal.
A practical approach:
- Standardise your identifiers. Use the same email and contact ID across registration, platform and CRM so records match cleanly.
- Push engagement, not just attendance. Watch time and Q&A activity are far stronger buying signals than a registration.
- Feed lead scoring. Let engagement depth adjust scores automatically, so sales prioritise the people who leaned in.
- Attribute influence, not just source. Events rarely close a deal alone. Measure their contribution across the journey, not only first touch.
Do this and event ROI stops being a hopeful estimate and becomes a reported figure.
What is the biggest mistake teams make with event data?
Collecting everything and reviewing nothing. Data without a routine is just storage.
The second biggest mistake is measuring events in isolation. One webinar tells you little. A quarter of webinars, compared against each other, tells you which topics, formats, run-times and speakers consistently perform. Patterns only appear at scale, so build a simple, repeatable review rather than a heroic one-off deep dive.
A third trap is confusing volume with value. A packed live stream that generated no follow-up conversations is a worse result than a smaller session that filled three deal pipelines. Judge events by outcome, not audience size.
How to build a simple event analytics routine
You do not need a data science team. You need consistency.
Before the event, decide the one or two questions this event must answer. Is it lead quality? Is it testing a new topic? Define success in advance so you measure against intent, not hindsight.
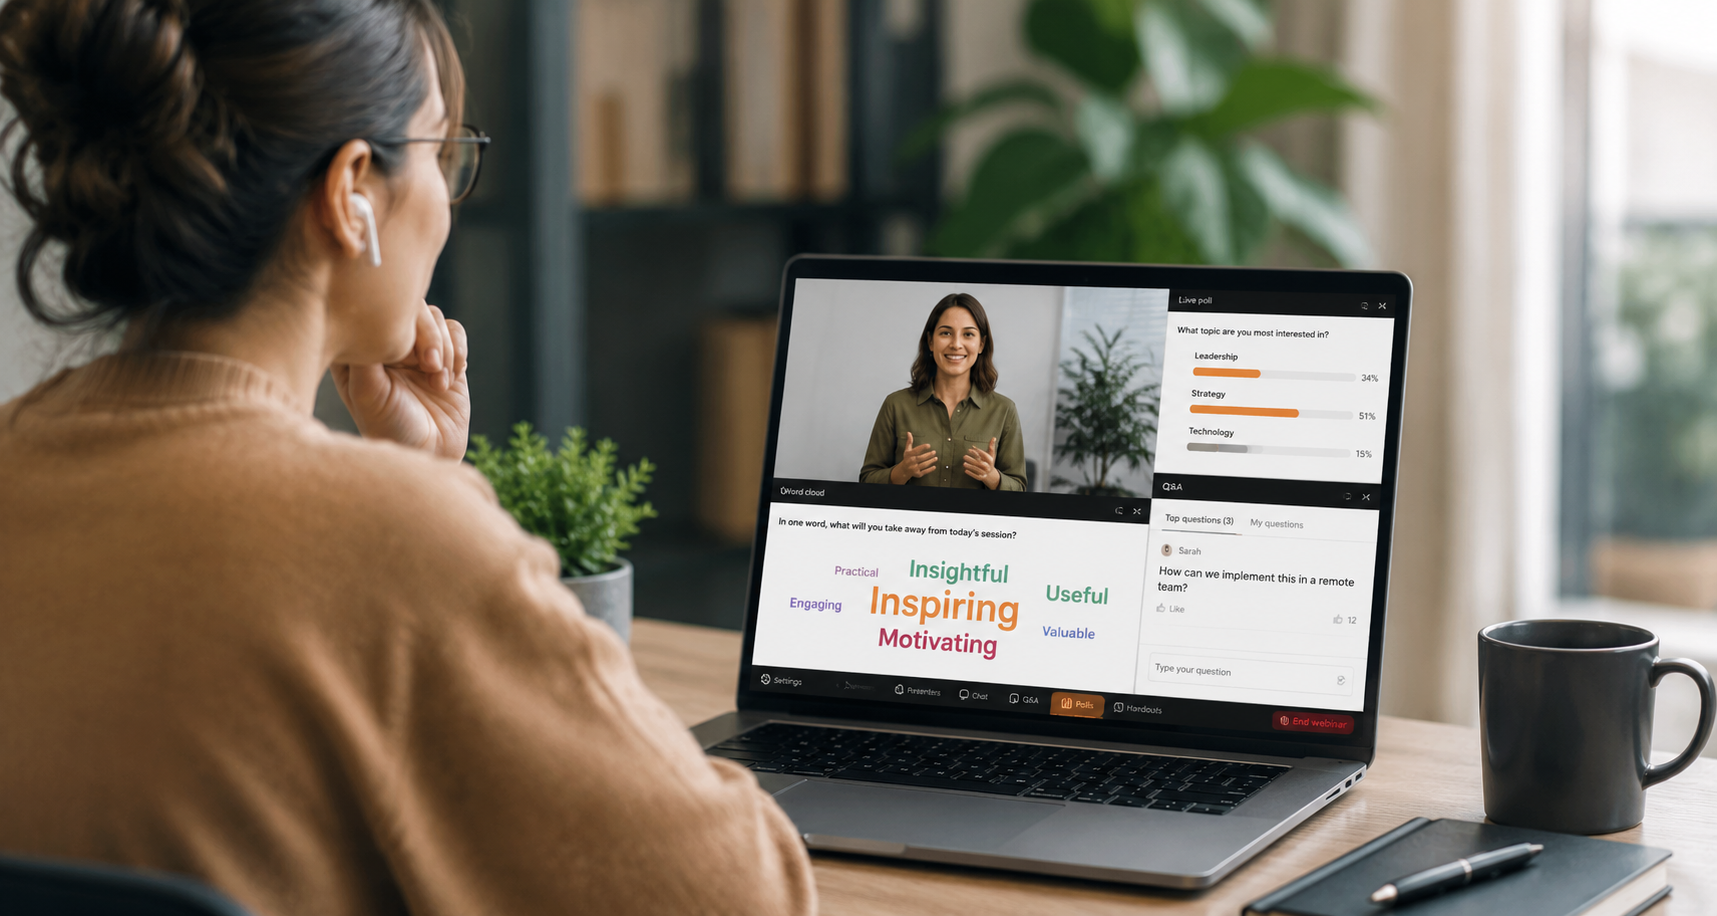
During the event, capture engagement in real time. Live polls, Q&A and chat are not just interaction tools, they are data collection. Every response is a documented interest.
Immediately after, pull the core numbers while they are fresh: attendance rate, average watch time, drop-off points, top questions, on-demand starts. Note one thing you would change.
Each quarter, compare like with like. Which formats retain attention? Which promotion routes deliver engaged rather than merely large audiences? Which topics generate pipeline? Let the trend, not the anecdote, guide your next calendar.
Turning insight into your next event
The point of all this is not a tidier dashboard. It is a better next event.
If drop-off spikes at the halfway mark, tighten your run-time or introduce an interactive break. If on-demand viewing dwarfs your live audience, invest more in the recording and its promotion. If one topic quietly outperforms everything, build a series around it. Every data point is a small instruction for what to do next.
Good event data analytics turns your event programme into a learning system. Each event teaches you something that makes the next one sharper, better attended and more clearly tied to revenue.
At WorkCast, we build our webinar, virtual event and live streaming tools so the data you gather actually flows where it needs to go, from live engagement through to your CRM. If you want to stop guessing at what your events achieve and start measuring it, that is a good place to begin.


.png?width=2380&height=2380&name=%E2%80%9CClick%20here%E2%80%9D%20to%20view%20our%20open%20uni%20handbook%20(1).png)