Understanding how to run a webinar is only half the battle, as you also need to know how to leverage your webinar data to maximize your results. So, before you even start planning your webinar, you need to define your business goals and which metrics you are going to track to get you there.
Without knowing which metrics to track and how to use your webinar reporting, all of your efforts will be for nothing. And so, we’ve compiled a list of some of the key webinar statistics to track and how to optimize your marketing materials for conversions at every stage of the webinar funnel.
7 Webinar Statistics to Track
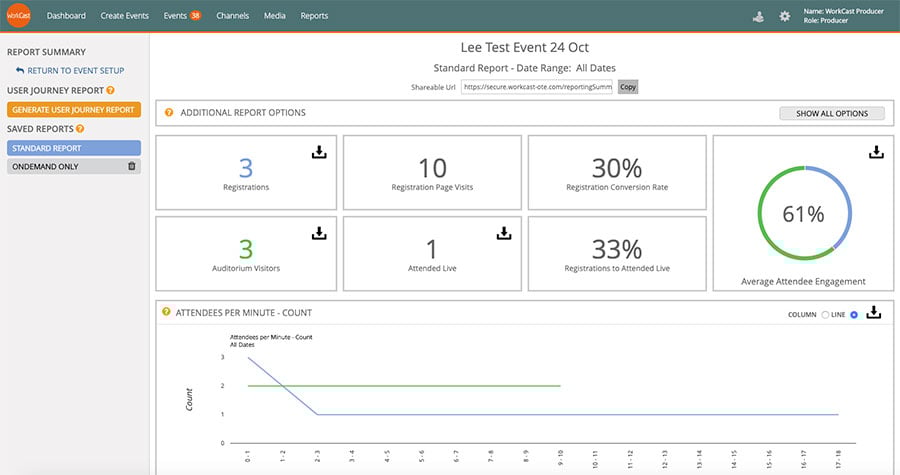
When running a live or on-demand webinar, or a virtual event, there are 7 main metrics you will want to keep an eye on when analyzing the results of your event:
- Registrations - The total unique registrants for the event
- Registration Page Visits - The total number of times the event registration page has been visited
- Registration Conversion Rate - The total number of registrations, divided by the total number of registration page visits
- Auditorium Visitors - The total unique number of attendees who have visited the main event presentation page at any time prior, during or after the live event date and time
- Attended Live - the number of people who attended the live event
- Registration to Attend-Live Conversion Rate - the total number of registrations, divided by the total number of live attendees
- Average Event Engagement - this is based on the average of an individual attendee’s engagement scoring (this metric is exclusive to WorkCast and is based on our own calculations)
Average Event Engagement
Now, you’re probably wondering how WorkCast calculates an individual attendee’s engagement score? We have created our own unique calculation that tallies different events an individual completes during your webinar, which includes:
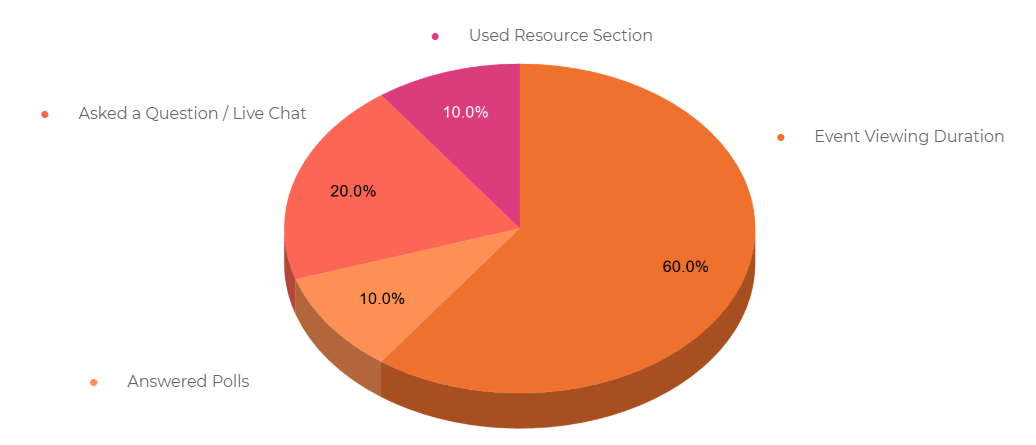
- Event Viewing Duration (60%) - If an attendee is active on the page for your event’s entirety, they will achieve a score of 60% for the event viewing duration
- Polls Answered (10%) - If an attendee answers one or more polls during an event they will gain a score of 10% for polls answered
- Submitting a text question/chat message (20%) - If an attendee asks one or more questions or submit one or more chat messages they will gain a score of 20%
- Document & Link Downloads (10%) - If an attendee clicks on one or more documents or link downloads in the documents section of the event, they will gain a score of 10%
With this engagement score in mind, an individual attendee can only receive a 100% engagement rate if you have all of these features enabled on your webinar. For example, if you don’t run any polls or allow users to submit questions throughout your webinar, then the maximum score an attendee can gain would be 70%.
Additionally, if your webinar is 60 minutes long and a person only watches 30 minutes of it before dropping off, then they will receive a score of 30% for event viewing duration. They will also receive the full 10% for polls answered if they answer at least poll question and the same goes for chat messages submitted.
| Read more: Learn how to get the most out of your webinars with our Ultimate Webinar Cheat Sheet. Read more.
Webinar Reporting at Every Stage of the Buyer’s Journey
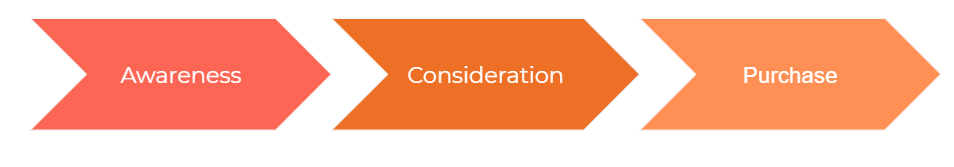
If you’re looking to use your reporting to ensure webinar success, then it’s important to track metrics at every stage of the buying journey i.e. the awareness, consideration and purchase stages.
How does the buyer’s journey relate to your webinar? Well, you should aim to take users through the different stages of the buyer’s journey with your webinar campaign - using your webinar invitation email and social media promotion to increase awareness, then prompting consideration with your reminder emails and finally driving a decision, or purchase, with your registration page and live webinar. That way, you can turn prospects into customers in no time.
By reviewing your webinar metrics at every stage of the buyer’s journey, you can ensure that you drive maximum results for your webinar. For example, by analyzing data such as email open rates and social media link clicks, you can determine what is working and what requires adjusting in the awareness stage. Similarly, by reviewing attendance rates in the latter stage, you can determine the effectiveness of your reminder emails and details like event time, day and duration.
Understanding the Webinar Funnel
The process of constantly reviewing data throughout every stage of your campaign relates not only to webinars, but to every digital marketing campaign you run. Here at WorkCast, we also use the webinar funnel as a way to interpret the data we collect - particularly when reviewing the effectiveness of our email marketing and landing pages.
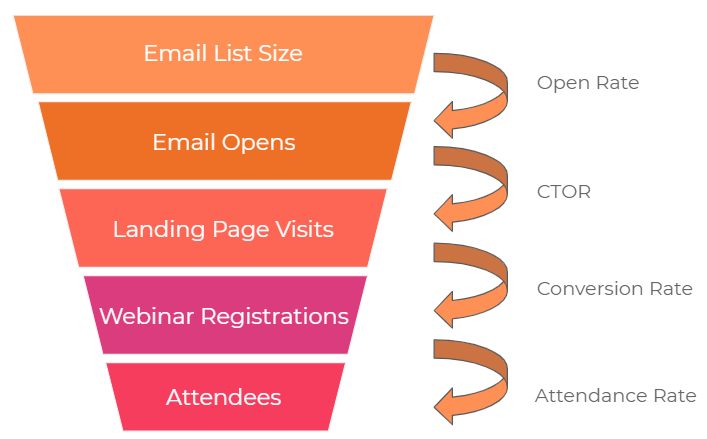
One of the most common problems people face when running webinars is how to leverage the data they collect and turn their insights into meaningful actions. An example of how we do this at WorkCast, would be reviewing our email open rates, which you’ll see cited at the very top of the webinar funnel. The industry average for email open rates is 20.8%, so if we notice that the open rates of our webinar invitation email drop much below this, it’s time to go back to the drawing board.
But how? The first thing we would review would be the subject line, as this is the very first thing that people see when they open their inbox. Ask yourself:
- Is the subject line short, punchy and relevant?
- Does it create a sense or urgency and drive action?
- Would you personally want to open it if you saw that subject line in your inbox?
If the answer is no, then we suggest testing different subject lines to drive maximum email opens. It’s also worth noting that emails with personalized subject lines are 26% more likely to be opened by recipients, so if possible, personalize email subject lines, as this makes people feel valued and encourages them to open the email.
The next level of the webinar funnel is the click-to-open-rate (CTOR) and involves measuring how many users opened your email and clicked through to your event landing page. Again, the industry average click-to-open rate is around 12.9%, so if the click-to-open-rate for your webinar is below 10%, then we recommend reviewing the following components of your email invite:
- WHAT: Your webinar title
- WHEN: Time of the webinar (date, time and duration)
- WHO: Webinar speakers, guests, hosts, etc.
- HOW: CTAs and instructions on how to register
- WHY: What are you offering attendees a.k.a ‘What's in it for me’ (WIIFM)?
Once you have reviewed email opens and CTOR, then we suggest you analyse the registration landing page visits. This level of the webinar funnel relates to the conversion rate (CR) i.e. how many people have filled out the online form and registered for your event. If the number of registrations from your landing page is below the industry average of 9.6%, then it’s worth reviewing the content on your registration page, as this is the gateway to your event.
You should always review your landing page content with these questions in mind:
- Do you have an optimized title?
- Is your copy compelling, relevant and provide valuable information about the benefits of attending to visitors?
- Is your call-to-action strong and drive action e.g. Register Now, Sign Up, etc?
- Have you used captivating imagery and photos of your speakers to bring a human face to the event?
If the answer is no to any of these questions, then I would always test some variations of copy and imagery to drive increased conversions from your landing page.
Finally, I want to leave you with some food for thought...
Promote, promote, promote!
It’s been said that the road to webinar success is doing promotions really well, so ensure that you start promoting your webinar 4 weeks out and drip feed users one invite a week up until the day of the webinar. We actually find that more than 35% of our attendees register the week of the webinar.
We increased webinar registrations more than 20% by sending an invite out on the day of the webinar.
Whether you’re looking to increase brand awareness, generate leads or grow your business, leveraging the data you collect is key to webinar success. Just like most tools in the savvy marketer’s toolkit, webinars are not an exact science, so it’s important to test different things and see what works best for you. And, don’t forget to use the data you collect, as there is a treasure trove of webinar insights at your fingertips.
Join us as we discuss How to Use Webinar Data to Maximize Your Results. Available on-demand now.

Share this

5 Ways To Find Webinar Topic Ideas

How to Host a Webinar at Home: Everything You Need to Know
