As marketers, we need metrics to back-up decisions on spend and to understand what to do more and of course less of! The same goes for webinars, the more metrics I can have on the success of my webinars the better I can make future decisions.
Here are the key metrics to look for when measuring the success of a webinar.
Attendee Conversion
Attendee conversion will show you how many of your registrants have actually attended your webinar. So getting 700 registrants may be bang on target for what you were looking to achieve with your advertising campaign. However if only 2 of those registrants attended live you might not consider that a success.
Typically we find the average registrant to attendee turnaround is 30 - 40%
Your attendee ratio can give you some vital information when looked at clearly. Looking at the demographic of those that attended against those that did not, could give some insight into the type of people that are interested in your webinar topic.

If you have a particularly low attendance you could look to improve your process for reminding registrants. Have you sent a calendar file or reminder email at any point? If not perhaps this could be used in future.
In addition to the above you can use the attendee information to identify key times or days that garner greater interest or attendance. We find that Mondays and Fridays tend to get lower attendance, while a Tuesday or Thursday afternoon tends to be the most popular webinar times.
Audience Retention
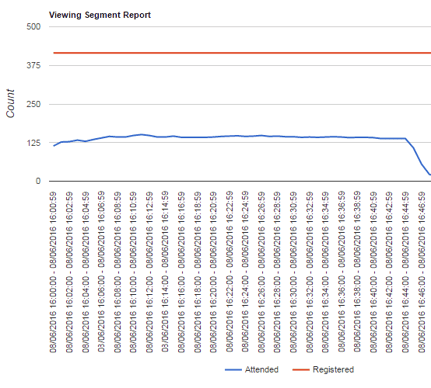
Audience retention metrics will tell you how engaged and interested your attendees were in the content being presented.
These metrics will give you information such as whether the content was as expected, whether they experienced technical problems and whether there are opportunities post webinar.

With this you can keep an eye on any key drop off points, and endeavour to identify the reason for any drop in attendance. You should keep an eye on attendee counts as the event goes on, and perhaps adjust content accordingly.
Poll Results
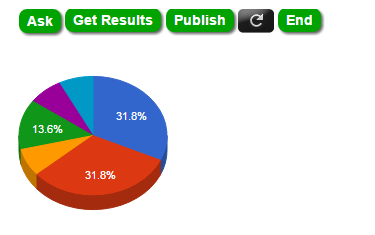
Using online polls gives you the opportunity to gain real-time feedback from your attendees. The data gained through polls can give you great metrics to help analyse the success of your webinar.

You can gauge level of engagement, level of understanding, opinion on topic and overall quality of presentation. It can also help speakers to frame and shape their presentations.
Attendee Feedback
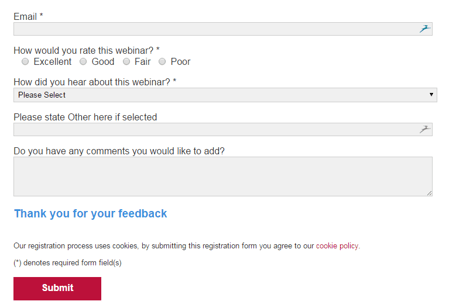
Exit surveys give you the opportunity to gain a host of post event webinar metrics. This is your opportunity to see whether the content of your webinar met the expectations of attendees.

You can request information on potential future topics, how the audience rates the presenter, how appropriate the information was, whether the audience feels they have benefited and much more.
As this is an end of event survey you may find that the longer the webinar runs over the lower the percentage of respondents.
On-Demand Viewers
On-demand webinar metrics show you how much interest there is in the particular topic. While live viewing metrics also show this, they are affected by those that are interested but unable to attend.
On-demand metrics can give you details on new leads that weren’t registered for the live event, and details on who found the content valuable. For example those that watched live and then revisited the on-demand. As with the live event it can give poll responses, assuming you include the polls in the on-demand.
While at first glance you may think your webinar was a huge success, however it is not until you look to the detail that you can truly gauge the outcome. All in all these metrics help to sharpen content and techniques for future webinars.
Integrating this kind of insight straight into a CRM system, or a marketing automation platform, is a Marketer’s dream.